Do People Actually Scan QR Codes? The Data FMCG Leaders Need to See
“Consumers don’t scan QR codes.”
If you work in FMCG, you’ve probably heard that sentence in a packaging review, a media meeting, or a retailer presentation. Sometimes it’s followed by: “We tried them once and nothing happened.”
Here’s the truth: it’s almost never the QR code that fails. It’s the execution.
No one blames Google Ads as a channel when a campaign gets a poor click-through rate (CTR). They blame the targeting, the creative, the landing page, or the offer.
QR codes deserve the same treatment. They’re just a tool. The question isn’t “Do people scan QR codes?” but “Did we give people a compelling reason to scan this one, right here, in this moment?”

What the numbers say: people do scan QR codes
A US connected-products study found that 92% of consumers are aware of QR technology, and 86% had scanned a QR code in the past year (Amic.media) . Another analysis focused specifically on food packaging reports 61% have scanned a QR code on a product after purchasing it (1worldsync).
GS1 found that 79% of consumers say they’re more likely to purchase products with a smartphone-scannable barcode/QR code that provides the product info they want.
So the awareness and the infrastructure are there. The real question for an FMCG brand isn’t “Will anyone ever scan?” It’s “What scan-rate can we realistically expect if we do this properly?”
Benchmarking QR scan rates vs Google Ads and email
To answer that, we need to treat QR like any other performance channel and look at benchmarks.
QR scan-through rates (FMCG & consumer goods)
By analysing previous activations by SeeGap, and industry wide bench marks the following metrics can be seen with QR code scans.
- Food & Beverages (FMCG): 4%-12% scan-through rate (Based on prior SeeGap campaigns)
- Wider Consumer Goods Categories: 4-11% scan-through rate (Based on prior SeeGap campaigns)
In other words, in well-run FMCG and CPG campaigns, roughly 5 in 100 people exposed to the QR actually scan.
So depending on category, creative and value exchange, realistic scan-rates on packaging span roughly 4–12%, with best-in-class promotions going far higher.
Google Ads CTR benchmarks
Recent Google Ads benchmark studies show:
- Average search ad CTR of about 3.2% across industries(Store Growers)
- Display ad CTR around 0.46% on average(Store Growers)
If 100 people see a typical search ad, 3–6 will click. For a display banner, often fewer than 1 in 200. Median search CTRs around 5% sit in the same ballpark.(AgencyAnalytics)
Email marketing CTR benchmarks
Global email benchmarks show:
- One large platform reports an average email click-through rate (CTR) of 3.25% across industries(GetResponse)
- Other compilations put average CTR closer to 1–2%, depending on sector and list quality.(Smart Insights)
So for every 100 people you email, you might expect 1–3 to click.
The simple comparison
Put those benchmarks side-by-side:
- QR on FMCG packaging: ~4–12% scan-through (higher with strong incentives)
- Google Search ads: ~3–6% CTR on average
- Display ads: ~0.5% CTR
- Email: ~1–3% CTR
When executed well, QR on packaging is not a weak channel – it’s often your highest-performing one.
So why do so many FMCG teams still say, “We tried it; it didn’t work”?
It’s not the QR code. It’s how you use it.
If a Google Ads campaign gets a 0.3% CTR, no marketer walks into the boardroom and declares: “Ads are dead. We’re never using Google again.”
Instead, they ask:
- Was the targeting right?
- Was the creative compelling?
- Did the copy match the search intent?
- Did we send people to a relevant landing page?
- Was the offer strong enough?
With QR codes on packaging, many teams jump straight from one poor pilot to “QR doesn’t work for our consumers.”
The data suggests the opposite: QR works extremely well when you get the fundamentals right. For FMCG, those fundamentals are very specific.
Five levers that drive QR scan rates on packaging
1. Placement in the real shopper journey
A QR buried on the back panel, under the fold, next to legal copy will underperform – no matter how clever the experience behind it.
High-performing campaigns treat the QR as a primary design element, not a compliance afterthought:
- Front-of-pack or near the main visual
- Enough white space so it’s visible at arm’s length
- Eye catching QR code, not your standard black/white design we’re accustomed to seeing
If shoppers can’t see it, they won’t scan it.

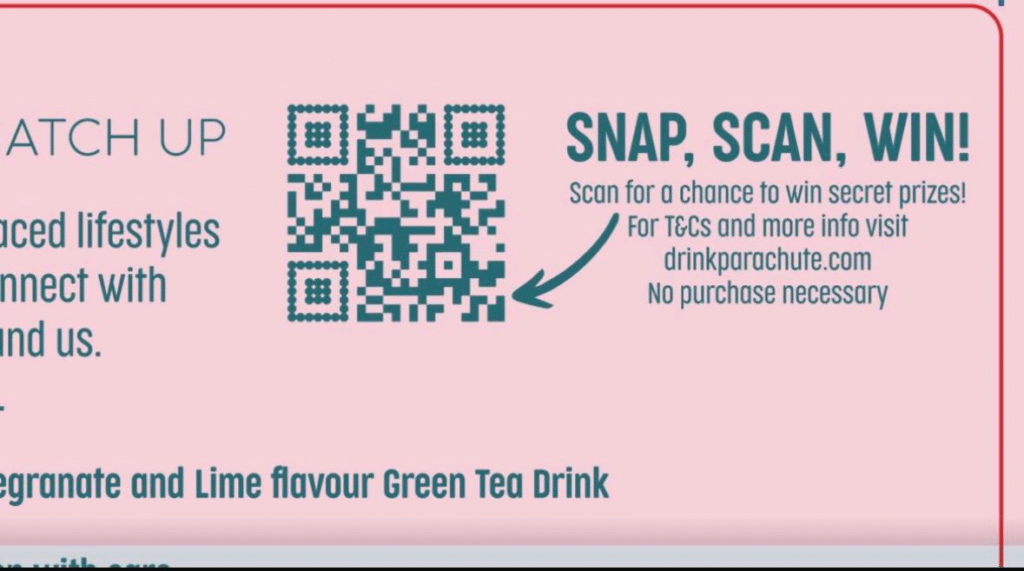
2. A concrete, specific call to action
“Scan for more info” is the QR equivalent of a banner that just says “Click here”.
Brands that win with QR are painfully clear about the payoff:
- “Scan to win monthly prizes”
- “Scan for detailed product benefits”
- “Scan to speak with this product”
- “Scan to claim instant cashback after purchase”
Bayer’s connected-packaging work around Berocca emphasised exactly this point: consumers only scan if the value exchange is obvious and helpful.(GS1 UK)
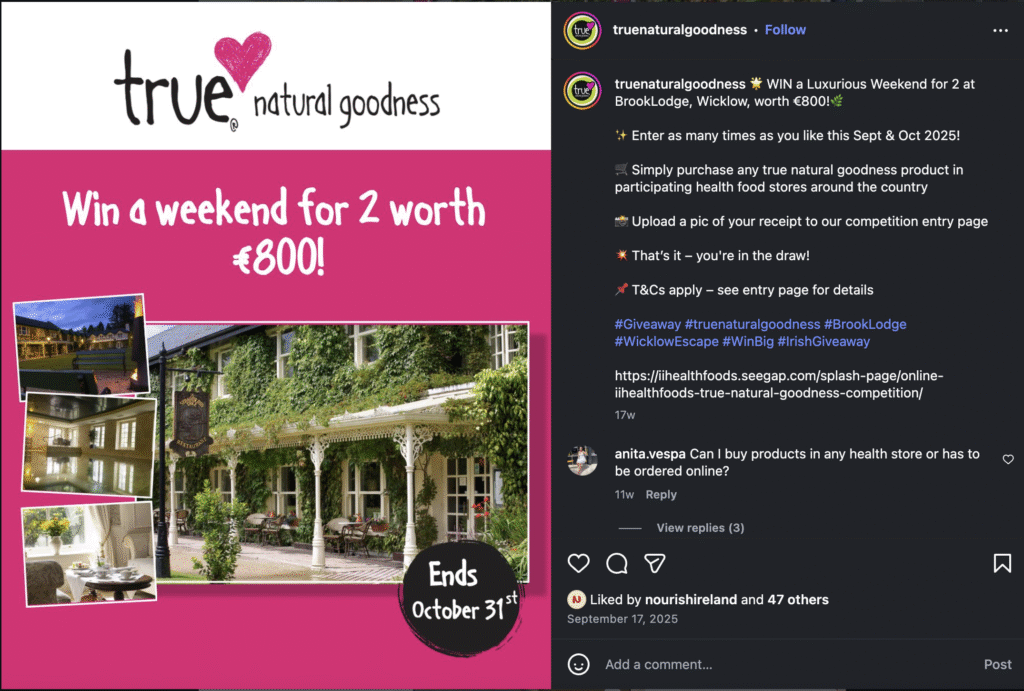
3. A genuine value exchange (not a generic microsite)
The strongest scan-rates come when the QR doesn’t just talk at the shopper; it does something useful.
Examples from real campaigns and benchmarks include:
- Connected packaging with ~14% scan-rates delivering educational content, recipes or loyalty rewards.(Time & Space Media)
- L’Oréal using QR codes on products to drive app downloads, achieving a 7% conversion rate and ~80% uplift in app installs.(uniqode.com)
- Ballymaloe Foods Scan-to-win campaigns in the UK where QR promotions achieved a 7% scan rate.
- Purato Wine achieving a 33% scan rate on a campaign with SeeGap
None of these results came from “learn more about our brand” pages. They came from clear, tangible value: rewards, utilities, tools, or content that makes the product more useful or exciting.
4. Frictionless experience design
Every extra step kills scans.
When a shopper scans from the aisle or the kitchen table, they expect:
- A fast-loading, mobile-optimised experience
- Minimal form fields to get to the value
- No app download required
- Content that fits portrait mobile, not a shrunk desktop site
SeeGap campaigns have shown that when experiences are designed for mobile and context, dwell times can exceed 90 seconds, or 4-5x higher than a corporate homepage.
5. Integration with the rest of your media
QR performance jumps when it’s not operating in isolation.
The strongest FMCG examples:
- Echo the same QR promise in TV, social, OOH and in-store
- Use packaging as the always-on anchor for promotions that rotate over time
- Treat QR codes as an always-on channel to reward and delight customers when they engage
QR on pack works best when it’s treated like a media channel with a strategy and measurement plan, not a box-ticking exercise.
Why this matters now: GS1 2027 and the “always-on” pack
The GS1 “Sunrise 2027” initiative is pushing the global shift from traditional 1D barcodes (EAN/UPC) to 2D codes such as QR with GS1 Digital Link. By the end of 2027, retailers are expected to have POS systems capable of reading both traditional and 2D barcodes.
Industry guidance is clear: 2D codes won’t just be a logistics requirement. They’re a strategic tool for richer consumer engagement, traceability, sustainability information and brand storytelling all from the same code.
For FMCG leaders, that means:
- The question is not whether QR codes will be on your packaging. They’re already there in most categories.
- The strategic question is what happens after the scan — and whether you own that experience and the data it generates.
So… do people actually scan QR codes?
The evidence is clear:
- Consumers know what QR codes are and use them regularly.
- In FMCG and CPG, connected-packaging campaigns routinely see double-digit scan-through rates, often 3–10x higher than typical Google Ads and email CTR benchmarks.
- When the value exchange is powerful (instant rewards, personalised tools, loyalty), scan-rates and downstream metrics like sales uplift can climb dramatically.
So if your last QR test under-performed, it’s almost certainly not because “our shoppers don’t scan”.
It’s more likely that:
- The code was hard to see
- The CTA was vague
- The payoff wasn’t strong enough
- The experience was slow or clunky
- The activation wasn’t amplified in your wider media
The good news is all of these are fixable. If you want to ensure you hit industry benchmarks or higher, and deliver ongoing engagement and value for your brand, reach out to us and we can walk you through how this opportunity looks.
The channel is already working. The only real question is whether your execution is.