See What’s Happening, As It Happens
See Real Shopper Behaviour In Real-Time
Listen. understand. act
Every interaction flows straight into your custom dashboard—creating a continuous feedback loop you can act on in real time. Track product performance across stores, regions, and campaigns. Spot underperforming SKUs, see engagement patterns, and adjust before small issues become big ones.
The Analytics Dashboard gives consumer brands a clearer view of their customers in the real world. No blind spots. No waiting weeks for expensive third-party reports.
Spot trends. Uncover opportunities. And confidently back your biggest business decisions with insights captured directly from your bullseye shopper.
Book a Demo with David
Learn about all the use cases of QR codes.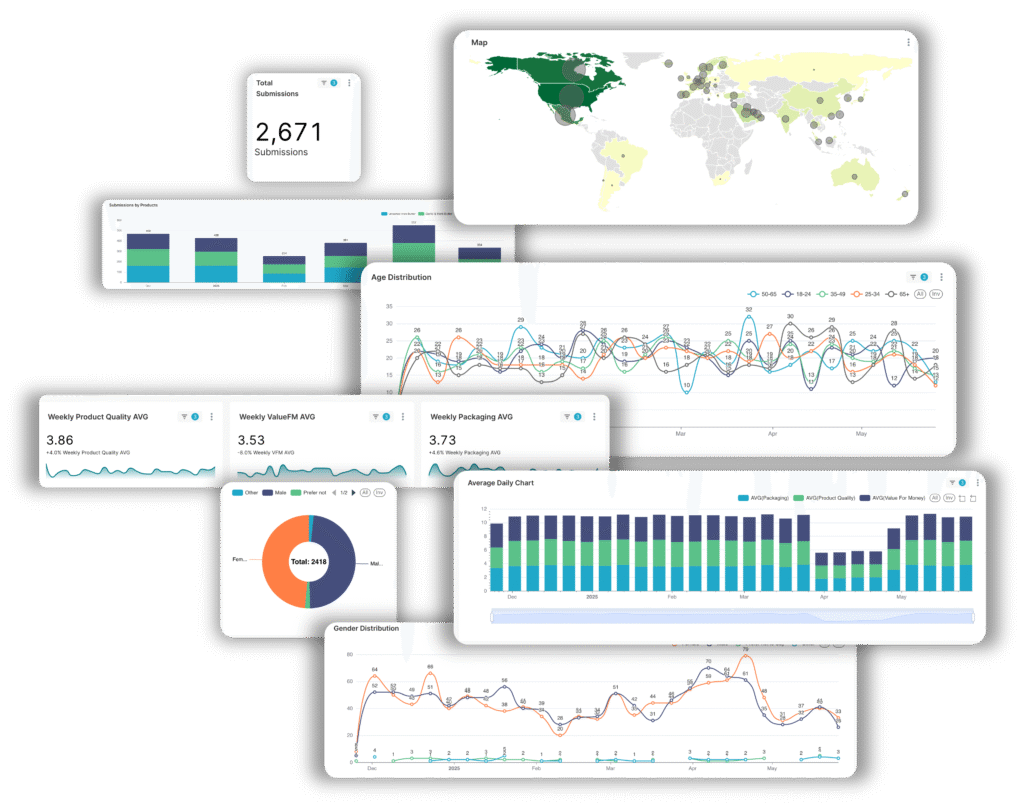


FEATURE
Real-Time Performance Monitoring
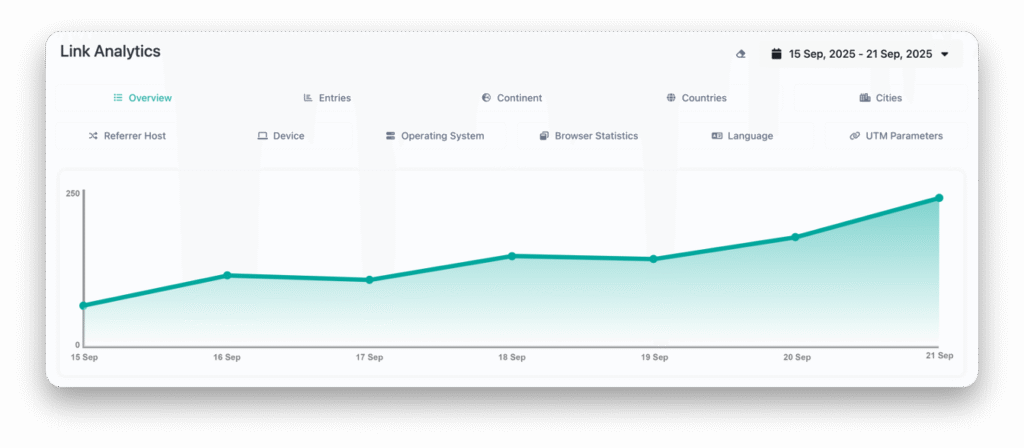
Watch product engagement metrics update live as customers scan and interact across all touchpoints.
FEATURE
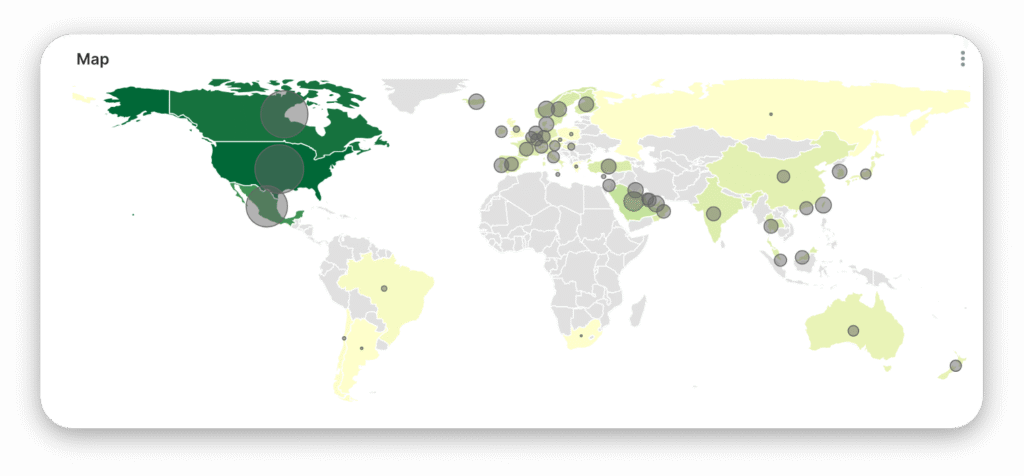
Geographic Heat Maps
Visualize performance by region, store, or postal code to identify market opportunities and challenges.
FEATURE
Trend Analysis
Spot patterns in customer behavior, seasonal variations, and emerging preferences before your competitors.
Dashboard Views That Drive Decisions
SeeGap’s Analytics Dashboard lets you track every product at a granular level. Get SKU-specific data in real time, see where shoppers are engaging with geo-targeting, and dive into detailed performance analysis across campaigns.
Executive Overview
High-level oversight for leadership teams to track brand performance at a glance.Key Metrics: Total scans, engagement rates, top-performing products, sentiment, behaviours, trends.
Regional Intelligence
Geographic breakdown of product performance and customer preferences.Key Metrics: Regional engagement, preference variations, market penetration, market A vs Market B.
Product Performance
Detailed analysis of individual SKUs across all markets and channels. Key Metrics: Scan volume, Quantitative & Qualitative feedback, repeat purchase intent, comparison across your entire range.Customer Insights
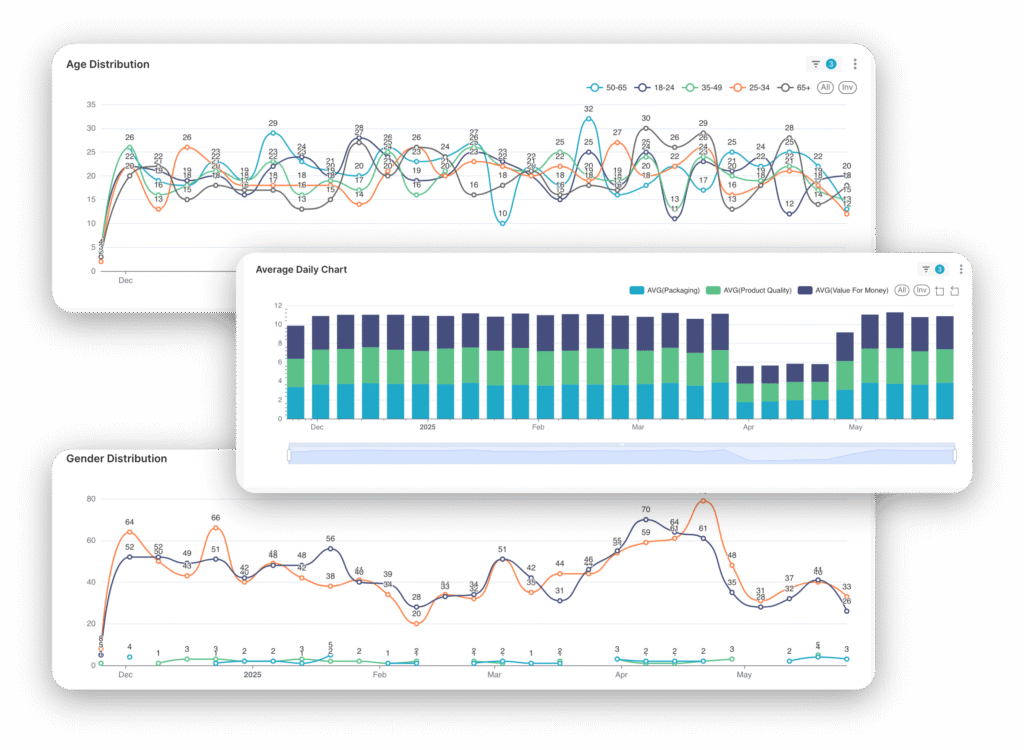
Understanding customer behavior patterns and journey analytics.Key Metrics: User demographics, engagement patterns, sentiment and behaviour analysis, potential opportunities and threats.
Quality Monitoring
Early warning system for product issues and customer complaints. Key Metrics: Peaks in negative reviews instantly flagged, quality scores, issue resolution times, retail specific performance.Campaign Analytics
Real-time tracking of promotional campaigns and marketing initiatives.Key Metrics: Campaign reach, participation rates, ROI, customer acquisition.
Who Uses What Data
Marketing Teams
Sales Teams
NPD Teams
Executive Leadership
We Recently collaborated with SeeGap to integrate QR codes into our packaging. Their team demonstrated exceptional knowledge and
expertise, ensuring a smooth process from start to finish.
We are thrilled with the results and highly recommend
SeeGap for their fantastic service, and professionalism.
We now have a much deeper understanding of our shoppers, richer CRM data, and a stronger ability to demonstrate and grow the value of our brand.
The feedback loop has been far more actionable than anything we had before, and it’s helping us shape both customer engagement and business strategy
Considering using QR codes
on your packaging?
Reach out to us for a chat on how you can get the most value out of them.